What’s new? The 2019 ENDURO reader survey
Well done everyone, you’ve earned a round of applause! More than 18,000 participants took the time to complete our 2019 reader survey and provide us with exciting insights: what, how, and where does the average ENDURO reader ride and what will she or he ride in the future? Which trends have managed to survive the past year? And which ones should we look forward to?
Since 2014, the annual reader survey has been a crucial part of our work here at ENDURO. It’s like a reality check and the most direct and effective way to learn about our readers and to question our own work, by seeking out criticism and feedback. Just as we need you to take us seriously as editors and testers, we have to take you seriously as our readers and try to understand your needs and interests. That’s exactly where our reader survey comes into the picture. Nearly 19,000 participants from 117 countries serve as an important indicator of the status quo in mountain biking and the many trends and developments from all over the world. Our latest survey was a tremendous achievement and one we can all be proud of. We use this valuable knowledge to plan our tests and articles – whether it’s your interests regarding brands, personal preferences and trends or your feedback on common issues and problems, they all have a direct impact on the content of ENDURO. Your feedback and your opinions are also crucial for the development of our app and website. And we’re not the only ones benefiting from the results of the survey. We share our anonymised analyses and data with many well-known manufacturers, who use them to improve both their strategies and products. In other words, you’re not just influencing the work of our editorial team but actively helping shape the future of the entire mountain biking industry.

The average ENDURO reader
Once again, Michael was the most common name among our survey participants. Out of almost 19,000 participants, 280 respond to the name of Michael, closely followed by David (236) and Thomas (234). But of course, we love all of you equally and are actually more interested in your personal preferences and interests than in your name. On average, ENDURO readers are 38 years old and have a net household income of € 71,440. Most of you own bikes from Specialized, Canyon and YT but more on this in a bit. On average, you have owned your bike for just over 2 years and spent € 3,400 on it. Your average annual distance ridden stands at 2,262 km. That makes up a sum total of 39 million kilometres! That’s more than the total length of the global road network, which is estimated at 32 million kilometres and enough to circle the earth about 1,000 times.

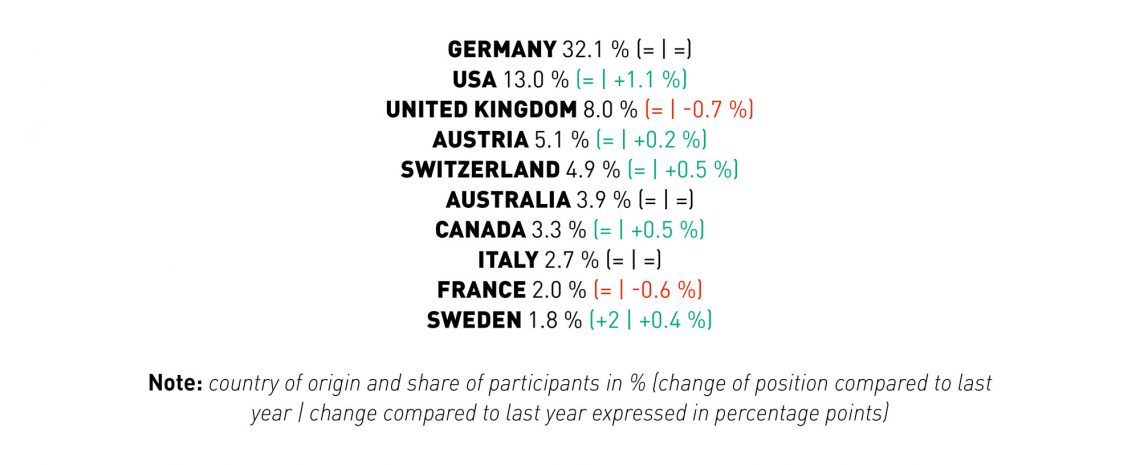
Where are you from? Countries of origin of our participants
The more than 18,000 participants stem from a total of 117 different countries. Our German readership constitutes one third of all participants and thus accounts for the largest share, followed by the U.S. with 13% and the UK with 8%. Overall, the top 10 countries make up around 77% of all participants. Accordingly, there are also many countries with very few participants, sometimes with numbers in the single digits. At this point, we want to send a special greeting to our participant from Dominica in the Caribbean. Feel free to contact us if you have an exciting idea for a travel story!
The top 10 countries of origin
The hottest trends of 2019
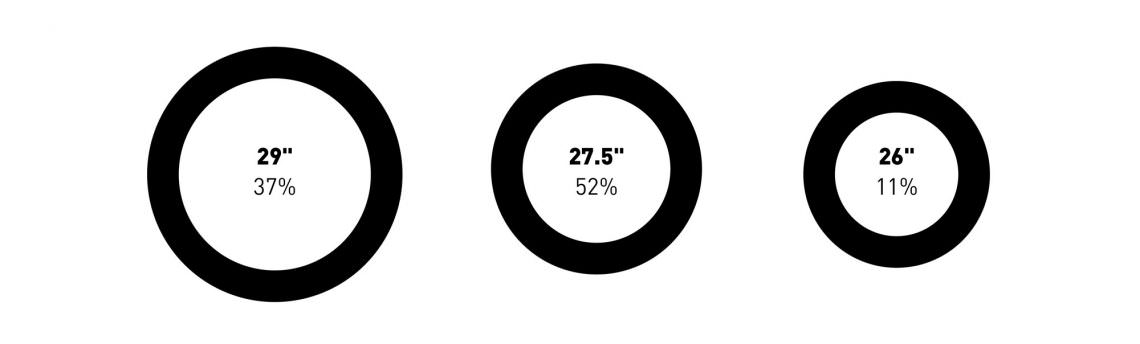
The mountain bike industry is constantly evolving. That means it’s worth taking a closer look at the trends of recent years that are still relevant today and see what’s in the pipeline for 2020 as well as what’s likely to become the new benchmark. Like in previous years, wheel sizes remain one of the hottest and most exciting topics. For the first time in years, the popularity of 27.5″ wheels suffered a clear decline, falling from 57 % in 2018 to 52 % this year. The main reason for this is the rapidly growing availability of 29” trail and enduro bikes since 2018. This year 37% of our readers hit the trails on 29 ” wheels, while last year it was just 27%. At the same time, the proportion of 26″ wheels continues to shrink and now stands at just 11%. These trends are likely to continue throughout 2020, as 56% decided to switch to a 29″ bike and just 32% will stick to 27.5″ wheels for their next bike. 26″ wheels make up just under 1% of all new purchases – we’re not surprised! It’s also worth mentioning that 4% of our readers are planning to switch to MX-inspired mullet set ups, with a 29″ front- and 27,5″ rear wheel.
Once again this year, 1x drivetrains are steadily gaining popularity with an 8% increase, which means 77% of all bikes are now running a 1x drivetrain. Here, we can no longer speak of a trend – single chainring drivetrains have long become standard.

Mail order brands or LBS?
Our survey also tells us where you bought your bike. While in previous years online brands managed to gain a bigger portion of the market share, this year the figures have levelled out. While 35% of our readers bought their bike online, 47% of them relied on a traditional bike shop. By the way, only 27% of our readers categorically refuse to buy from mail-order brands. Moreover, 17% of participants opted for a second-hand bike. And there’s a new entry in our rankings this year: leased bikes, which make up over 1% of the field, with JobRad accounting for the largest share of the lease-market – 67% to be precise. At the moment, however, bike leasing is still an almost exclusively German phenomenon, with pretty much 90 % of leased bikes being in Germany. If we were to look at Germany alone, the share of leased bikes would represent over 3% of the total.

Cheaper prices are still the main reason for you to buy online. Whilst people who bought from online retailers spent an average of € 3,343 last year, those who bought their bike from a bike shop spent an average of € 3,826. For used bikes the average price stands at € 2,290. The financial advantage of leased bikes is obvious: since you can afford more expensive bikes you spent an average of € 4.216.
Growing satisfaction
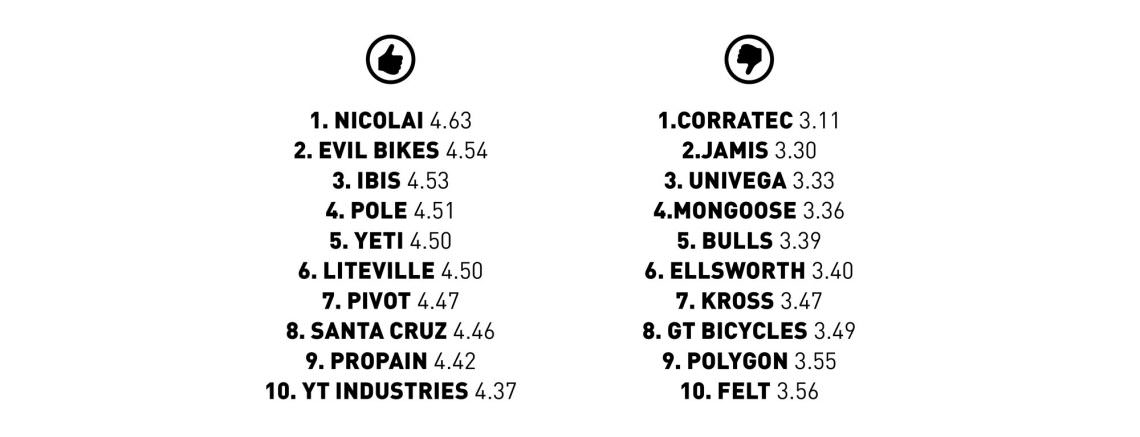
In order to understand how happy you are with your current bike, we asked you to rate your level of satisfaction with your bike on a scale of 0 (not satisfied) to 5 (fully satisfied). We’ve got some very good news: at 4.14, this year’s average score is not only very good but also slightly higher compared to last year’s 4.06 points. And that’s even more impressive considering that the average age of bikes has risen from 21 to 26 months compared to last year’s survey. The older the bike, the less likely you are to be satisfied with its performance. If we were to take into account only bikes that are 2 years and older, average satisfaction would only stand at 3.9 points. Among the top 10 brands with the most satisfied customers are both some old acquaintances and some new faces. This year, NICOLAI was able to gain one position and thus make it to the top of the rankings. Evil is in 2nd place and Ibis in 3rd. Last year’s leader Pole fell back to 4th position.
More love for the (eMTB) world! Your thoughts on eMTBs
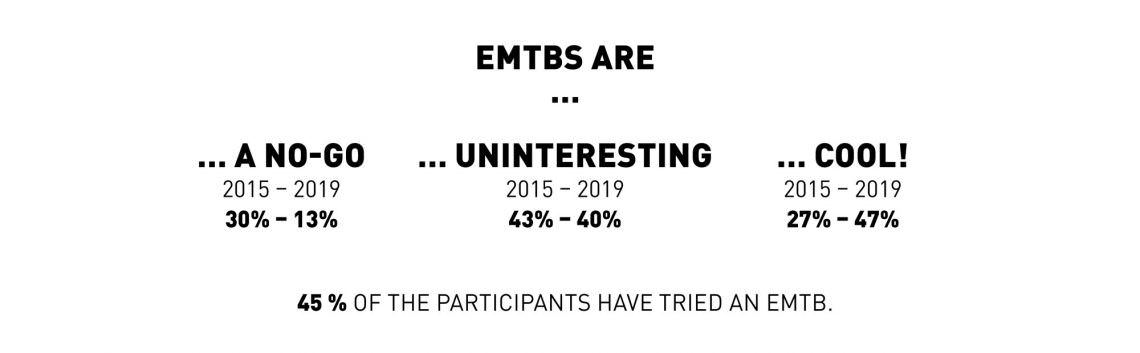
Interest in eMTBs bikes is growing year by year. As a consequence, in 2019 the group of eMTB supporters grew by 4%, and now stands at a total of 47%. At the same time, only 13% of our participants see eMTBs as an absolute “no-go” while the remaining 40 % are indifferent. Indeed, 6% of you already own one. There are plenty of reasons to ride an eMTB: it’s a brilliant alternative means of transport, a superb sports tool for people with disabilities and health problems, a great way to compensate for fitness disparities between riding buddies or within a group, and, above all, it’s lots of fun! Nevertheless, there are still people who vehemently oppose eMTBs. We wanted to know why and what might lead to this attitude. Against all expectations, there’s no connection with the age or the level of experience of the rider. On the contrary, it turns out that the most ardent eMTB opposers are performance-oriented riders. Accordingly, your typical eMTB hater covers an annual mileage of 2,588 km – about 15% above average – uses an XC bike more often than our average reader and also tends to go for longer rides than most people, often covering distances of 50 km, 80 km or even more.
While there are some clear regional differentiations, it’s interesting to see how individual countries respond to the eMTB phenomenon. In the USA 16% of our readers still have a negative attitude towards eMTBs, but 38% of them welcome the new trend – last year, it was just 32%! And while on an international scale these numbers might seem marginal, they’re still telling us that even in the USA, eMTBing is becoming increasingly popular. Yet, the USA is also the country with the highest percentage of people who seem to have no clear opinion on eMTBs. The main reason seems to be that in many areas of the US, eMTBs are not as widespread as in Europe and still have the same legal status as motorcycles, creating conflict on the trails. It’s also interesting to see how the traditional bike countries like Italy and France are responding to supported MTBing: here, there are more eMTB critics than in other countries, but also more people who are showing a genuine interest in the subject, leading to more polarised views.
By the way, 45% of all participants have at the very least tried out an eMTB.. If you take a closer look at this group, you’ll notice that a meagre 7% is against eMTBing and a whopping 61% is in favour. While it’s hard to determine how the two groups may condition each other, we know for sure that most haters will change their mind after spending just a few minutes on an eMTB. So, if you’re getting curious about eMTBs, go and have a look at our sister magazine E-MOUNTAINBIKE. Here you’ll find extensive tests, practical tips and suitable travel destinations for your eMTBing hit.
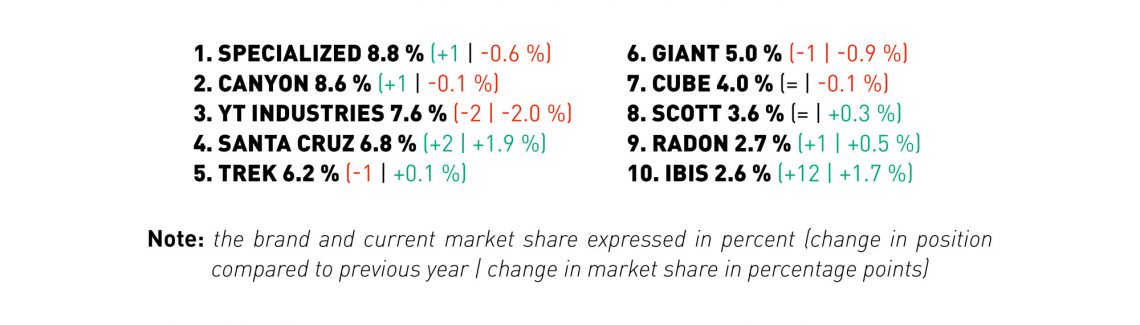
Top 10 – the most ridden mountain bike brands of ENDURO readers
The top 3 positions have switched places this year. While former leader YT is now in third position, last year’s second most popular brand Specialized climbed into first place. Meanwhile, Canyon has moved from 3rd into 2nd place.
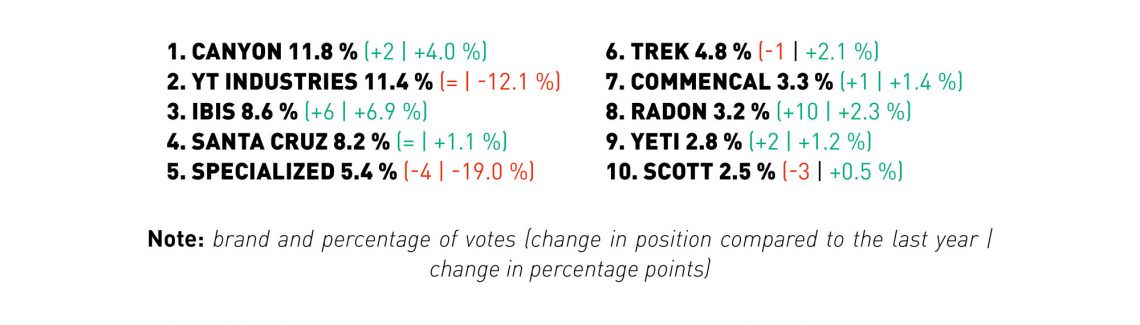
Which brand will you buy next?
We don’t have a crystal ball to tell us the future but our survey comes pretty close – at least when it comes to the bikes you want to buy next year. Mail order brands Canyon and YT are neck and neck and together, dominate the field by some margin. In 3rd place comes Californian brand Ibis. It’s worth mentioning that all of the 3 most popular brands secured a test victory in one of our 2019 group tests. While this is definitely no coincidence, it clearly proves that you have good taste and that you make well-informed purchasing decisions. Meanwhile, Specialized waited way too long to launch a very attractive product and have therefore fallen back into 5th position – having taken the top spot last year.
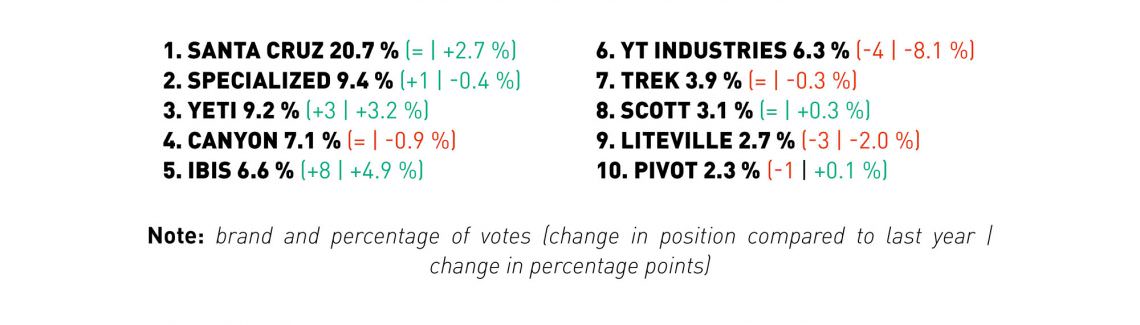
Your favourite brands in the mountain bike world – best brands 2019!
Like every year, we asked which brands you think build the best mountain bikes and components. This is of course a very subjective matter – after all, not many of us have the opportunity to test and compare many different products first hand. Nevertheless, your answers told us clearly which brands worked hardest in the past season to gain your trust. With over 18,000 participants, the most representative mountain biking survey in the world provided the results we needed. Those brands that ranked first in our best brand vote can rest assured that their brand image, product range, marketing and product performance left an excellent impression on our readers. Once again, Santa Cruz remains the undisputed leader, securing almost 21% of all votes. Specialized and Yeti trail with a considerable gap, ranking second and third respectively, each securing just over 9% of the total votes. Head over to our web page to find the exact results of our Best Brand selection, including components and clothing.
Travelling with your MTB
Finally, we’ve noticed a clear tendency to combine holidays with mountain biking and we completely understand why: on the one hand, it’s a great way to spend quality time in nature and to learn more about the people and the country you’re visiting – a unique opportunity you wouldn’t get as a normal tourist. On the other, it’s a fantastic opportunity to gather family and friends to embark on exciting adventures on two wheels. The numbers speak for themselves. Last year, a total of 72% of participants travelled with their mountain bikes, spending an average of nine days and € 170 per day on cycling holidays. When choosing your holiday destination, you attach great importance to good cycling infrastructure, which consists of a well-maintained, signposted trail network and good transport links, including lifts and shuttles. The Alps remain the most popular holiday destination, with the Lake Garda region being your absolute favourite. However, Scotland and Wales are also becoming increasingly popular mountain biking destinations.
Lucky winners
Not only does our reader survey help us to get to know our audience better, it also gives us the opportunity to say thank you to two of you — and we want to do this with a very special gift! With the kind support of our lottery partners Ibis and RADON, we raffled two dream bikes for our participants. The lucky winners are:
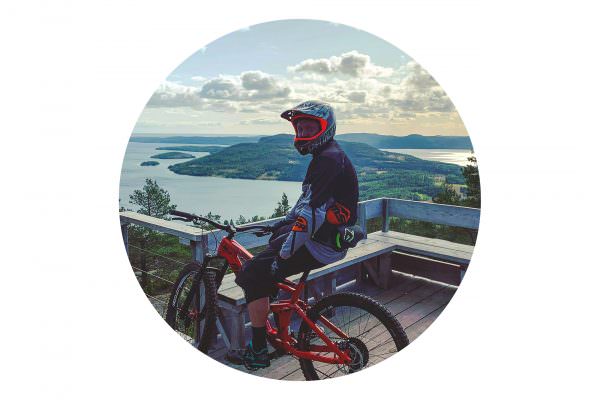
Miika from Sweden
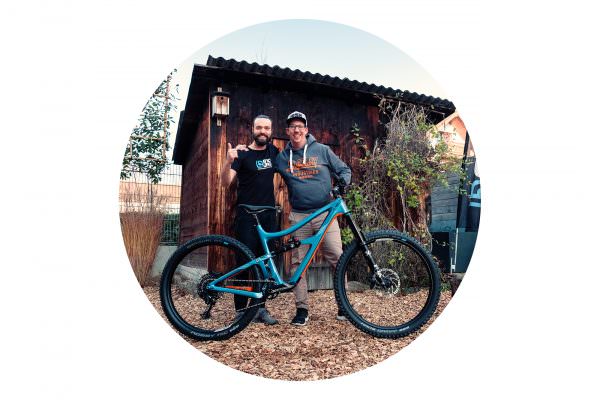
Tobias from Germany
Thanks again to all of you for your incredible support, participation and engagement!
Did you enjoy this article? If so, we would be stoked if you decide to support us with a monthly contribution. By becoming a supporter of ENDURO, you will help secure a sustainable future for high-quality mountain bike journalism. Click here to learn more.