The bike industry is experiencing turbulent times, that’s for sure. But what about you guys? What does the typical ENDURO reader look like in 2021 and will we all soon be riding mullet bikes? Over 21,000 readers from around the world answered our questions. Below you’ll find our summary of the most important developments in the mountain bike world.
We’re on a roll! And this explicitly includes you too because without you – our readers – there is no us! So, before we dig into the results, big thanks are in order. From May to July 2021 over 21,000 ENDURO readers accepted our invitation to participate in our annual reader survey. This is a massive achievement, especially when you consider that the individual survey includes up to 80 questions. We want to thank each one of you! You’re a part of the largest and most representative survey in the mountain bike industry.
The largest and most representative survey in the mountain bike industry!
Thanks to the vast number of readers who participated, we’ve got an even clearer picture of what makes you tick and inspires you. That way you’ve made an invaluable contribution to our work because we want to feature the bikes and content that is relevant and interesting to you. However, you’re not just shaping the work of ENDURO, but also influencing the development of the entire industry. The fact is that many well-known brands feed the results of our survey into their product development – all the info is shared anonymously, of course.
Who are you?
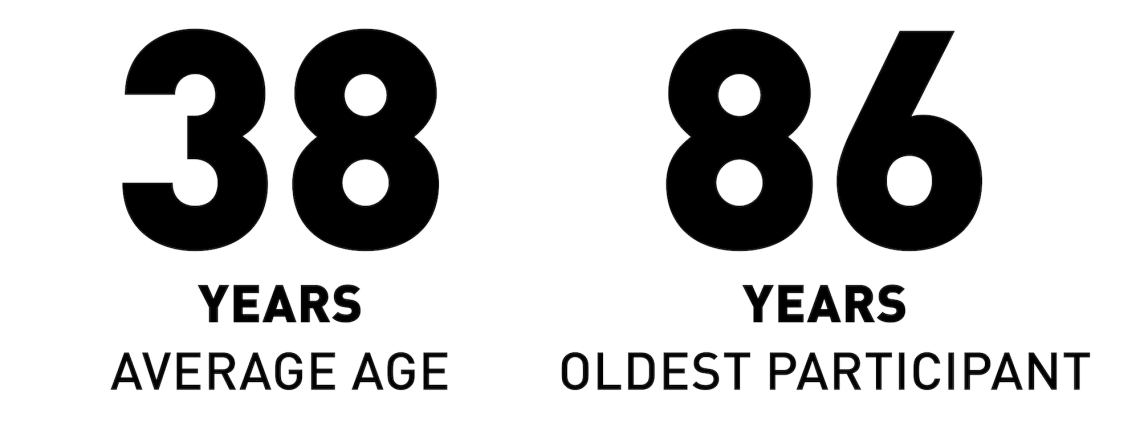
What does the typical ENDURO reader look like in 2021? The average age of our readers remained unchanged at around 38 years, while the oldest participant is 86 years old. Just like last year, the most common male name is Michael. This year, Lisa tops the list of our female readers. After a slight decrease last year, your average net household income has recovered and is roughly the same as in 2019 at around € 71,000.
Where are you from?
Our survey participants are spread across 117 countries. However, German-speaking countries make up the largest part. 43% reside in Germany, 6% in Austria and 5% in Switzerland. After Germany, the USA ranks second with around 8% of our readers hailing from across the pond. Great Britain follows closely behind, also coming in at 8%. The remaining 30% are spread over 112 different countries. Including some countries with just a few and some with just one participant. Hello Kazakhstan, Madagascar and the Caribbean island of Dominica.
How long have you been riding mountain bikes?
Most of you are seasoned mountain bikers with an average of 14 years of experience. The number of newcomers has decreased by around 2 percentage points this year, though they still account for 3.5%. By the way, around 1% don’t even own a mountain bike yet. It’s a good thing we’ve got all the know-how you need to get started!
AVERAGE ANNUAL DISTANCE: 2,189 km
What kind of bikes do you own?
Considering the focus of our magazine, it’s not surprising that enduro bikes are the most popular amongst our readers. You can find them in 60% of your garages, basements and even living rooms. That’s three percentage points more than in the previous year. Coming second, trail bikes remain stable at 44% and road bikes are roughly on par with last year at 25%. XC bikes are losing favour with our readers at just 23%. The gravel and eMTB categories recorded the biggest gains, increasing by 3 percentage points to 15% and 12%, respectively. If you’re interested in drop bar bikes or want to learn more about e-powered mountain bikes, we recommend checking out our sister magazines GRAN FONDO and E-MOUNTAINBIKE. They’re full of the same spirit as ENDURO, just different bikes! And if you prefer something more geared towards the urban jungle, then have a look at DOWNTOWN!
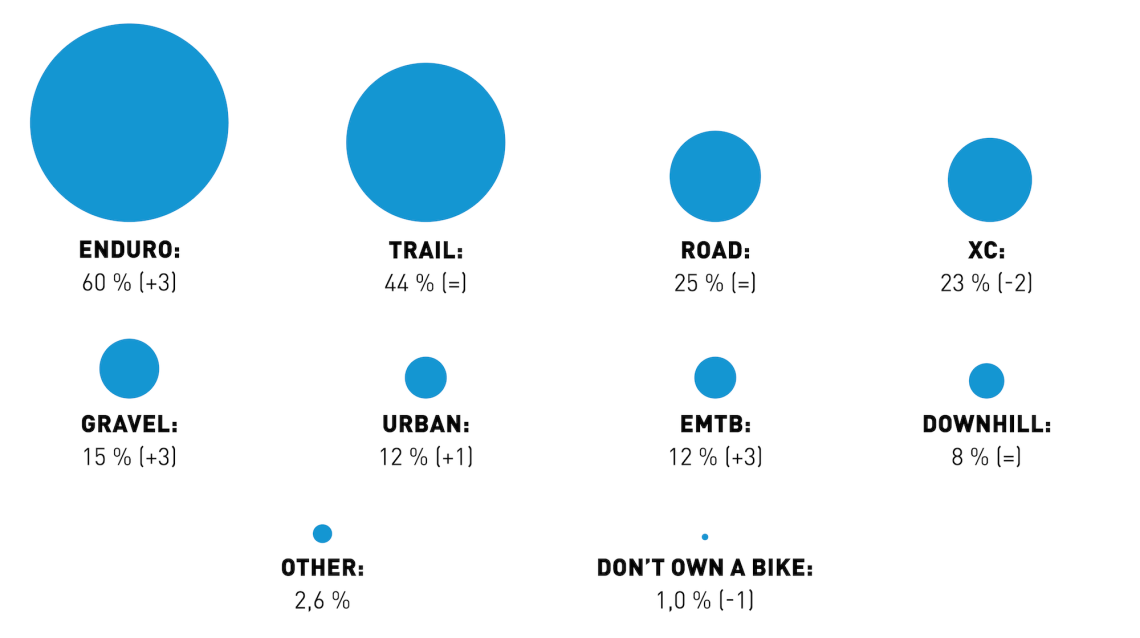
Multiple selections were possible.
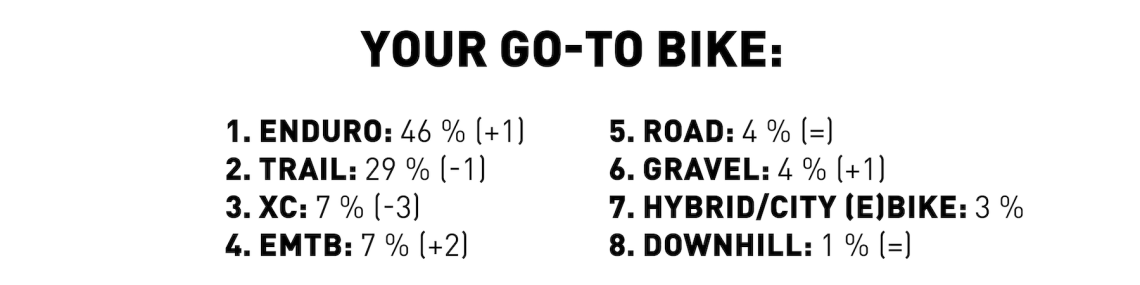
Which bike do you ride the most?
Since most of you own several bikes – an average of 3, by the way – it’s interesting to see which one you prefer to ride. The answers reflect the responses to the previous question. Enduro bikes come first with 46%, while trail bikes come second with 29%. XC riding comes third with 7%, which means that it’s decreased by three per cent compared to the previous year. The biggest winners are eMTBs, which are now the preferred bike to ride for 7% of our readers, increasing by two percentage points. By the way, you spent an average of around € 3,800 and have owned the bike for 33 months.
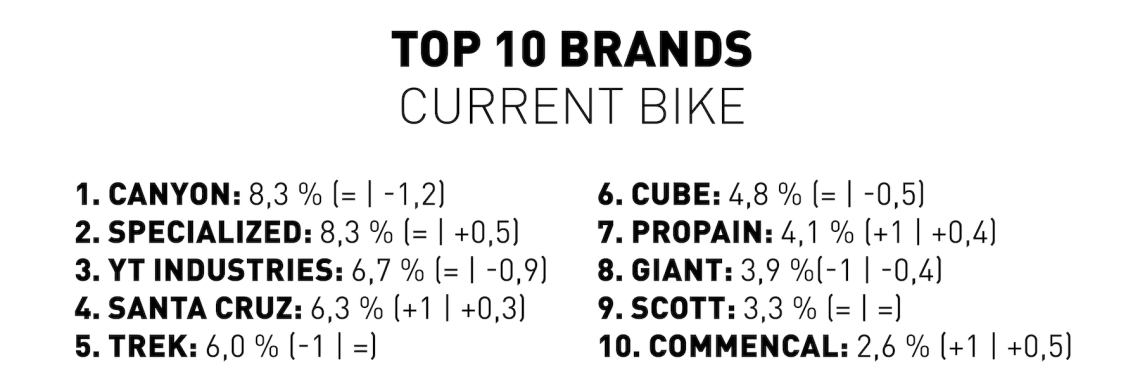
Which bike brands do you ride?
This year just three participants separate the results of the two front runners! Canyon can hold on to the top position thanks to this slim lead, putting them ahead of Specialized once again. Both make up around 8.3%. Third place also remains unchanged, going to direct-to-consumer brand YT, who have lost around one percentage point at 6.7%. Santa Cruz have improved slightly, relegating Trek to fifth place. Propain have also made slight gains, as have the Andorran bicycle brand, COMMENCAL, climbing into the top 10.
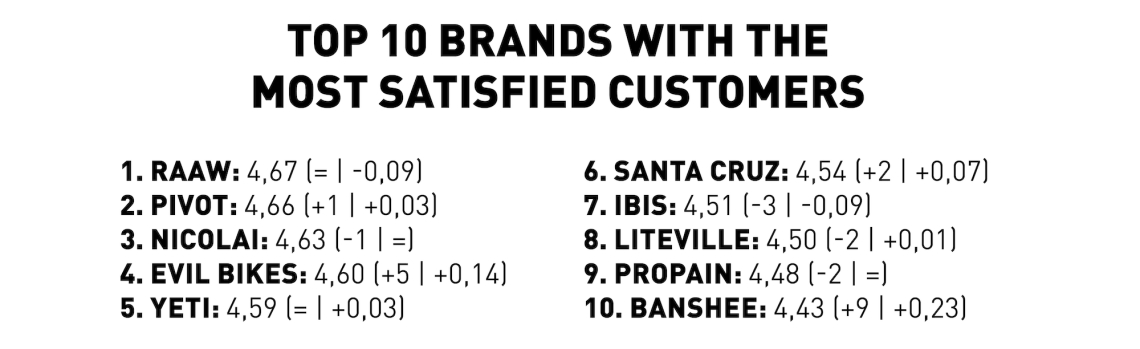
How happy are you with your bikes?
We asked you to rate your favourite bike on a scale from 0 (not at all satisfied) to 5 (fully and completely satisfied). After the overall average dropped slightly last year, it has caught up again this year, achieving a record value of 4.23.
AVERAGE SATISFACTION:
4.23 (+0.12 COMPARED TO THE PREVIOUS YEAR) | NEW RECORD!
There are some old acquaintances among the brands with the most satisfied customers. RAAW take the crown once more with an average customer satisfaction of 4.67. Pivot come in just behind them at 4.66. NICOLAI follow in third place with an average of 4.63, proving to be remarkably consistent, as this is their third consecutive year with the same score! Evil Bikes have improved significantly and made up five places with an increase of 0.14. Santa Cruz and Banshee also recorded significant improvements, Banshee catapulting themselves up nine places and putting them in tenth with a gain of 0.23.
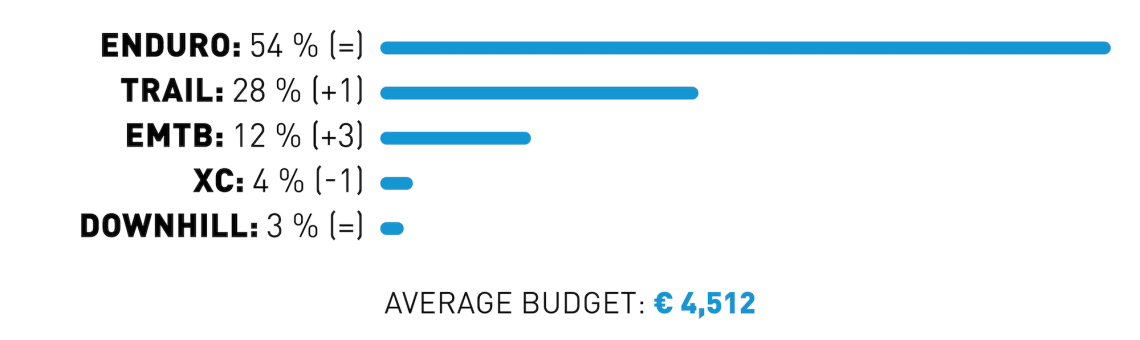
What do you want to buy next?
The type of bike you want to buy next is closely related to your current bikes. Enduro bikes continue to dominate, accounting for 54% of our readers’ planned purchases. Trail bikes are at 28%. That said, the boundaries between these two categories are becoming more and more blurred, so don’t be blinded by categories and simply look for the right bike for your terrain and riding style instead. A big winner in this category too are eMTBs, making up 12% and thus gaining three percentage points. Our readers’ average budget is around € 4,500, up by more than € 500 from last year! Overall, total of 26% of the participants are planning to buy a new bike in the near future, while 32% are still undecided. Either way, we’ll give you all the advice you need!
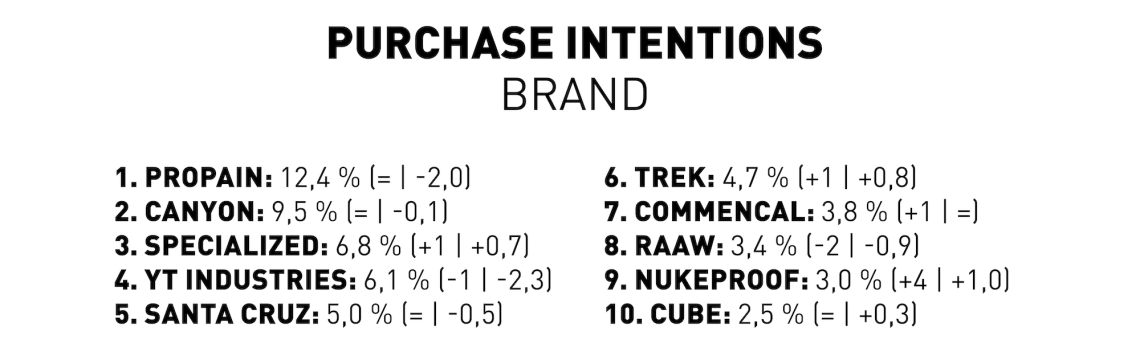
Which brand do you want to buy next?
The sensational winners from last year, Propain, have managed to remain in the lead! Canyon are back in second place, followed by Specialized and YT, who have swapped places. A big winner in the top 10 are Nukeproof, jumping from 2% to 3% and thereby moving up four positions to 9th place.
What defines a good bike for you?
We asked you about the three most important criteria that led you to buy your current bike. Clearly, performance is essential as that was one of the decisive factors for 65% of our readers when choosing a bike, particularly handling and suspension performance. The components also play a significant role for 56% of you. The price is a very relevant factor for around 50 % of our readers.
PERFORMANCE: 65 % | COMPONENTS: 56 % | PRICE: 49 %
The demands you have for your next bike are similarly performance-based. For this question, you were able to give a rating on a scale from 0 (not at all important) to 5 (very important). The most important criterion was the handling with an average of 4.48, closely followed by the suspension with 4.46. The components come in third place with 4.13. We agree with this rating, the components are undoubtedly important, but the basis must be right first and foremost. Though less important, ride comfort (3.92), design (3.57) and price (3.52) were also rated highly. Weight got an overall rating of just 2.98 and brand image seems to matter even less at 2.69. Of course, we can’t rule out that brand image may have a subconscious effect!
What else do you do besides biking?
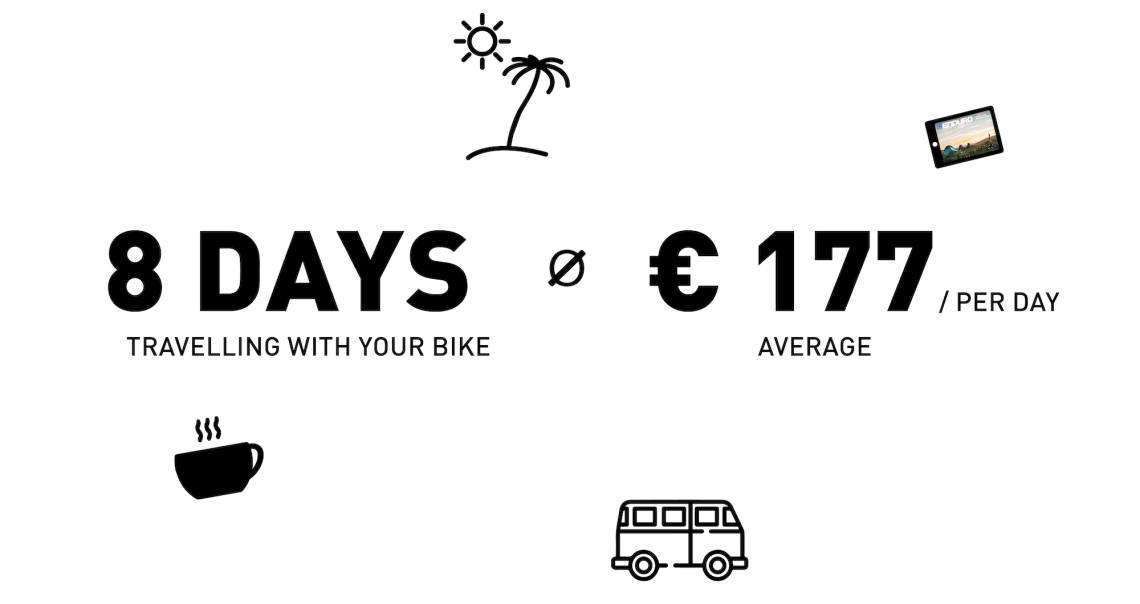
Besides biking, travelling is one of your favourite hobbies, which interests 41% of you. We’re with you on that! It’s a good thing that biking and travelling play so well together. So, it comes as no surprise that you spent an average of around 8 days travelling with your bike last year, whether it was at a bike park, doing shuttle laps or riding on your own. While travelling, you spent an average of € 177 per day. We’re particularly proud of the fact that 32% of you indicated that one of our stories inspired you when choosing your destination. We hope to have many new travel stories coming soon. Camping and van life also remain very trendy, with 37% of you indicating an interest in these. Other interests of yours include computers, gadgets, cars and photography. To nourish your body, you like good coffee or beer.
More trends from the mountain bike world
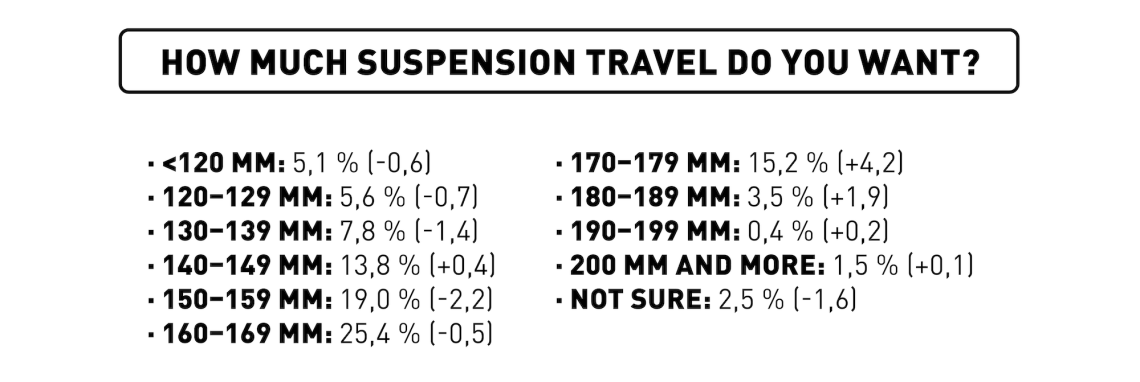
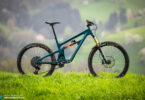
FOR YOU, THE SWEET SPOT USUALLY SEEMS TO BE AROUND 150 OR 160 MM, THOUGH WE’RE INCREASINGLY SEEING OUR READERS GOING FOR 170 MM OR MORE.
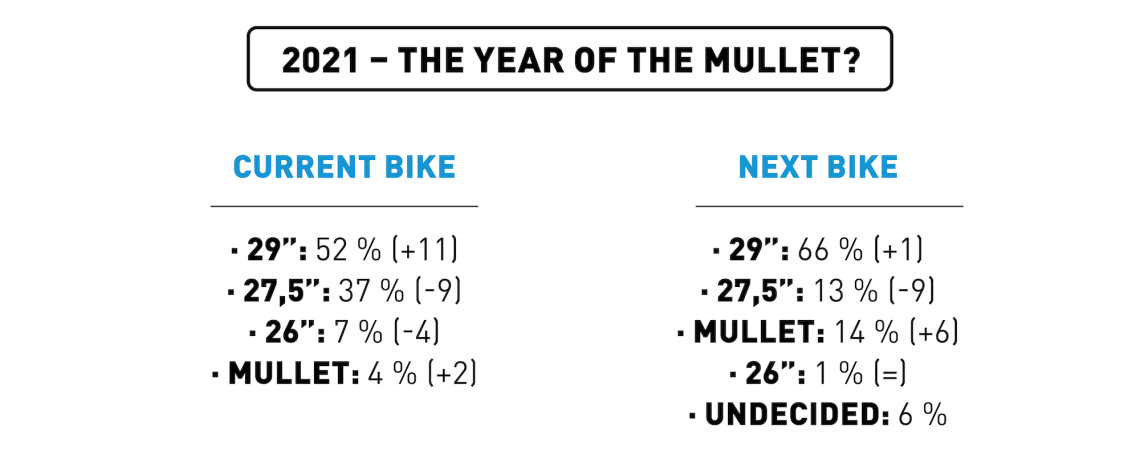
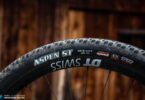
THE BUZZ AROUND MULLET BIKES HAS NEVER BEEN LOUDER AND IT SHOWS ON YOUR BIKES. THEIR MARKET SHARE HAS DOUBLED WITHIN A YEAR, COMING IN AT 4%, WHILE 14% OF OUR READERS ARE PLANNING TO BUY A MULLET BIKE NEXT, OVERTAKING PURE 27.5″ MODELS FOR THE FIRST TIME!
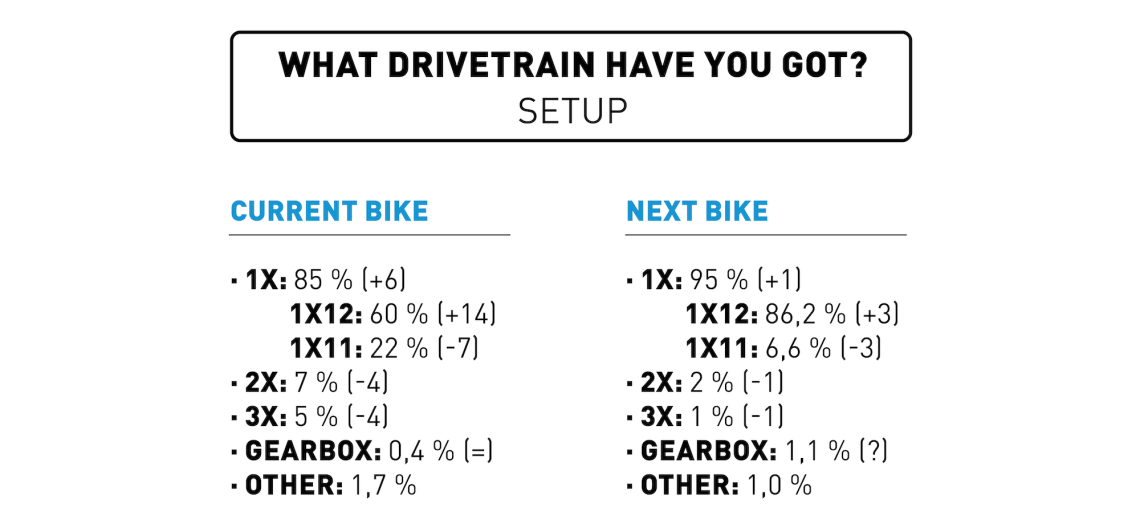
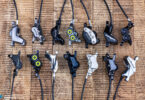
BOTTOM LINE: 1X RULES!
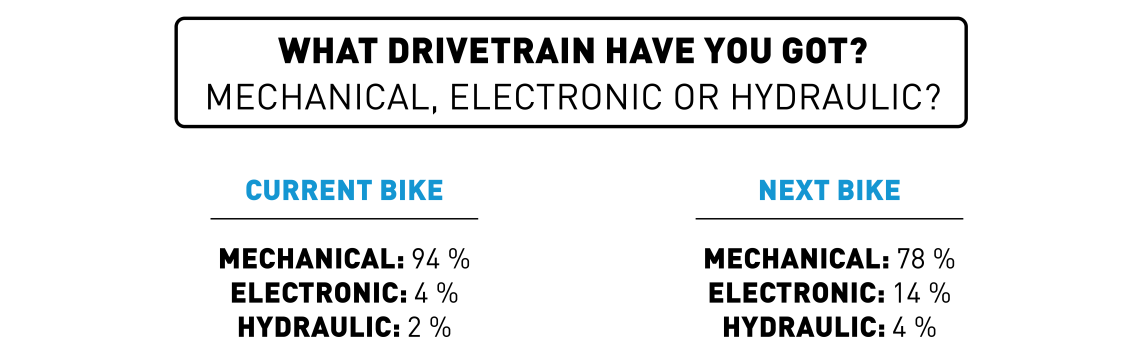
TRIED AND TESTED TECHNOLOGY STILL SEEMS TO GO DOWN BEST IN THE MOUNTAIN BIKE SCENE! ELECTRONIC DRIVETRAINS ARE HAVING A HARD TIME BECOMING AS WIDELY DISTRIBUTED AS THEY ARE IN THE WORLD OF DROP BAR BIKES.
How do you like our products?
The reader survey presents an excellent opportunity for us to get feedback on our work. Besides plenty of constructive criticism, we also got a lot of praise – thank you for both!
Our app has been very well received and gets used regularly by 42% of you. On average, you gave it a 4.5-star rating. The free, digital magazine is at the heart of what we do and undoubtedly the best way to experience our content. It offers lots of interactive features, high resolution images and videos, and a unique design. If you haven’t yet, download the app now!
The lucky winners
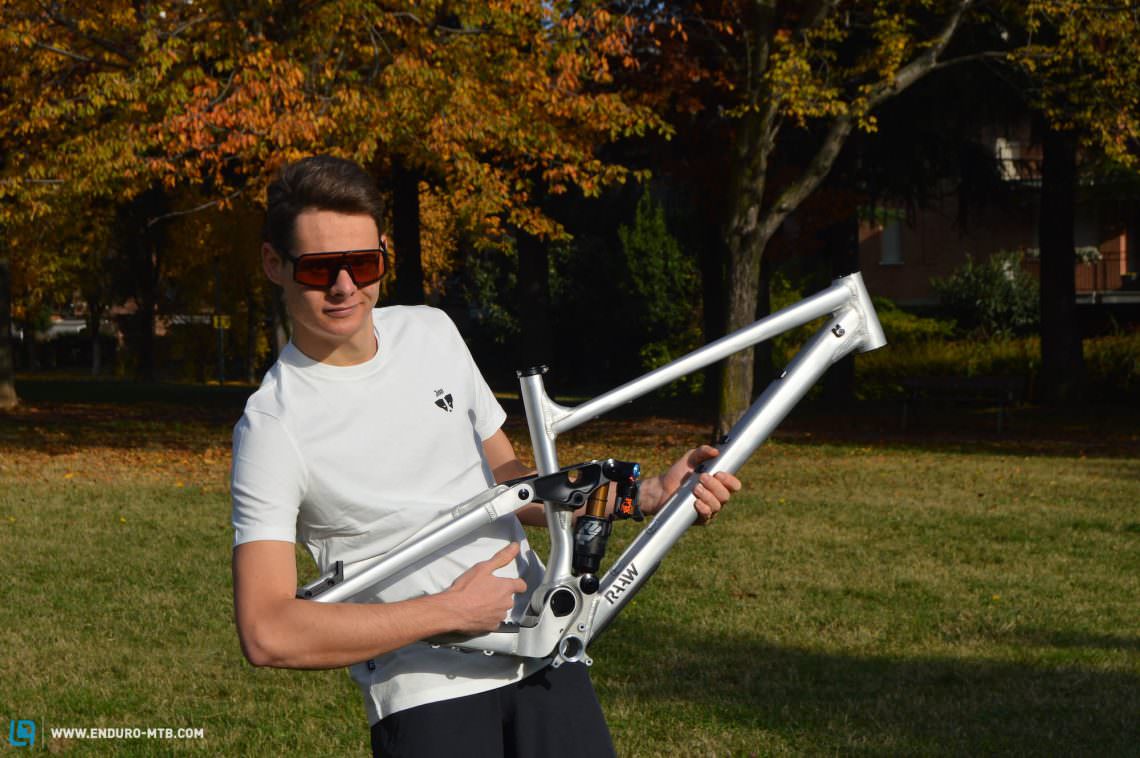
One of the reasons we like our reader survey so much isn’t just that we can get to know our readers better, but also that we can surprise one of you with a new bike. For this year’s survey, we partnered with RAAW and Prime to raffle off prizes valued at over € 9,000. One lucky reader, Gabriele, already received his RAAW Jibb frame. Unfortunately, due to shortages, Mateusz from Poland will have to wait a bit longer for his Prime Thunderflash to arrive.
So, these are the results of our 2021 reader survey. And as you can see, it’s worth participating for a variety of reasons: you can help the industry, our team and win some stuff. Sweet! Many thanks for doing the survey and remember to keep your eyes peeled for the next one in the spring of 2022.
Note: In our experience, the brand that provides the prize bike can have a slight advantage, with more fans of the brand likely to take part, potentially slightly skewing the results in that brand’s favour.
Did you enjoy this article? If so, we would be stoked if you decide to support us with a monthly contribution. By becoming a supporter of ENDURO, you will help secure a sustainable future for high-quality mountain bike journalism. Click here to learn more.
Words: Photos: Julian Lemme