What does a typical ENDURO reader look like? Which trends and brands have shaped the mountain bike world in 2022 and did we proclaim the year of the mullet too soon? Nearly 15,000 ENDURO readers heeded our call to take part in our reader survey and provided great insights into the status quo of the mountain bike world.
First of all, we’ve got to say this: Thank you! Without the almost 15,000 loyal ENDURO readers who took part in our survey, none of this would even be possible. Without you there is no us! We are incredibly grateful for your contribution. With up to 90 individual questions, this was the most extensive reader survey we’ve ever conducted and thus an even bigger ask from you, our readers. You’re a part of the largest and most representative survey in the mountain bike industry.
The largest and most representative survey in the MTB world!
Thanks to the huge number of readers that participated, we’ve got an even clearer picture of what makes you tick and what inspires you. That way, you’ve made an invaluable contribution to our work because we want to feature the bikes and the content that is relevant and interesting to you. You’re not just shaping the work of ENDURO, though, but also influencing the development of the entire industry. The fact is many well-known brands feed the results of our survey into their product development – shared anonymously, of course.
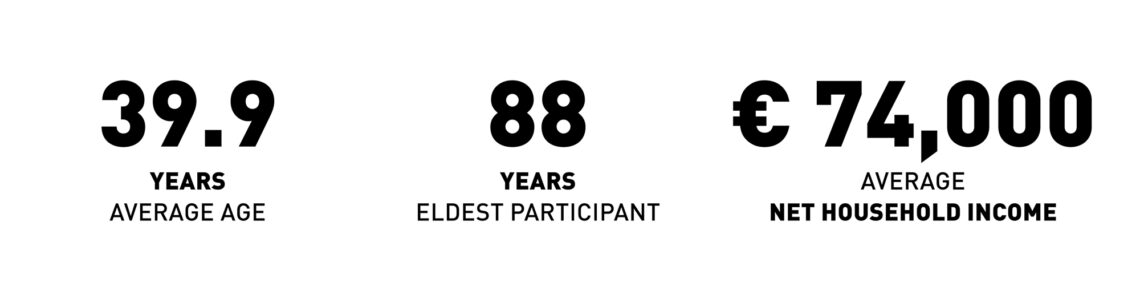
What does the typical 2022 ENDURO reader look like? Fortunately, in keeping with the theme of this issue, the proportion of women rose by one percentage point, now standing at a total of 4%. There is still a lot of potential for growth here, but we’re pleased with the development. With the average age having remained fairly consistently at 38 in recent years, we saw our readership mature by about two years, coming in at just under 40 this year. The eldest reader is 88 years, thus breaking last year’s record by two years. Your income has also grown by more than € 3,000. This brings you to an average net household income of about € 74,000. There was a head-to-head race among the most common ladies’ names with Karin, Laura and Christine having to share the crown this year. For the gentlemen, the first place goes to all the participants called Michael, as usual.
Where are you from?
This year, our reader survey participants are spread across 107 countries. Again, the German-speaking countries make up the largest part. Germany accounts for 45%, Austria for 7% and Switzerland for 6%. In the overall ranking, the US ranks second with 7%, toppling the United Kingdom from third last year, which is down to fourth at 6%. The remaining 30% are distributed among 102 different countries. There were some tiny countries with just a few and even just one participant. Of course, we’re happy about every single one of you. Greetings to Saint Vincent in the Caribbean and to the Kingdom of Bhutan, supposedly the world’s happiest country.
Germany: 45% | USA: 7% | Austria: 7% | UK: 6% | Switzerland: 6%
How long have you been riding mountain bikes?
Most of you are veteran mountain bikers with an average of 15 years’ experience, which, fittingly, is one year more than in 2021. Newbies who have gotten into riding less than a year ago are up to 2% this year. About the same number of readers haven’t even started riding mountain bikes. Of course, we’ve got plenty of know-how to get you started. We’d recommend checking out our interactive buyer’s guide! It will help you find the right bike.
Average annual distance ridden: 2,149 km (30 km less than the previous year)
What kind of bikes do you own?
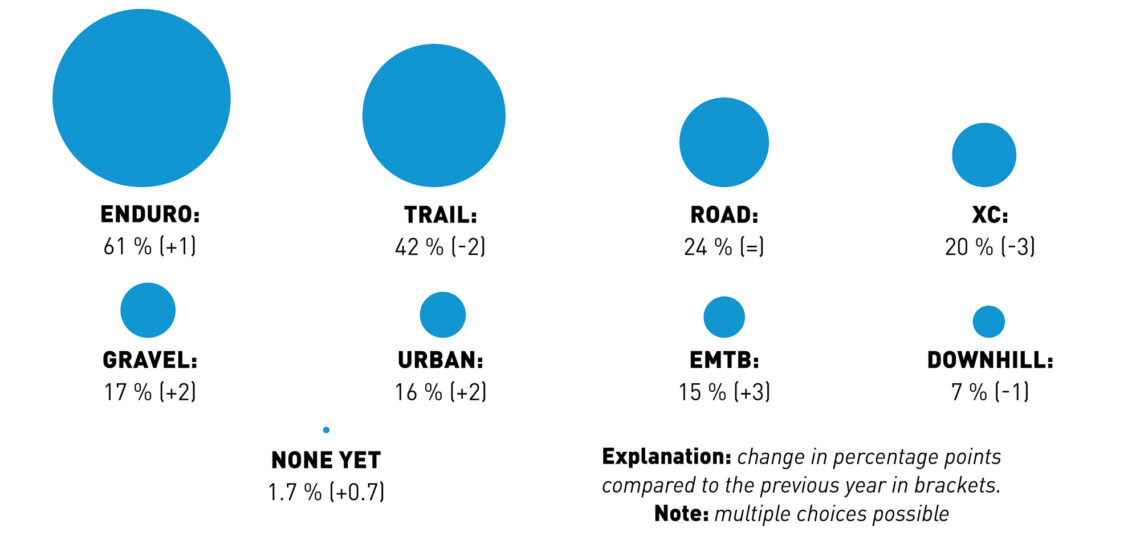
Given the name of our magazine, there’s no prize for guessing which is the most popular type of bike, but there are some interesting developments, nonetheless. Enduro bikes remain in first place, up 3 percentage points from last year at a total of 60%. Trail bikes are in second place with 42%, down 2 percentage points from 2021. Third place among bikes with knobby tires goes to the XC category, which comes in at a total of 20%, recording a drop of 3 percentage points. Gaining ground behind them are the eMTBs at 15%, marking a growth of 3 percentage points. Downhill bikes have dropped by 1 percentage point, now making up 8% in total. So much for the mountain bikes, but you also ride other bikes, of course, and, in fact, road bikes make up 24% of the bikes owned, putting them in third place overall. Gravel bikes are coming dangerously close to XC bikes, growing by 3 percentage points this year to make up 17% of the total. Urban bikes are faring well, too, now reaching 16%. No matter what kind of bike you ride, we’ve got you covered with our sister magazines GRAN FONDO, E-MOUNTAINBIKE and DOWNTOWN for the necessary know-how in every category.
Which bike do you ride the most?
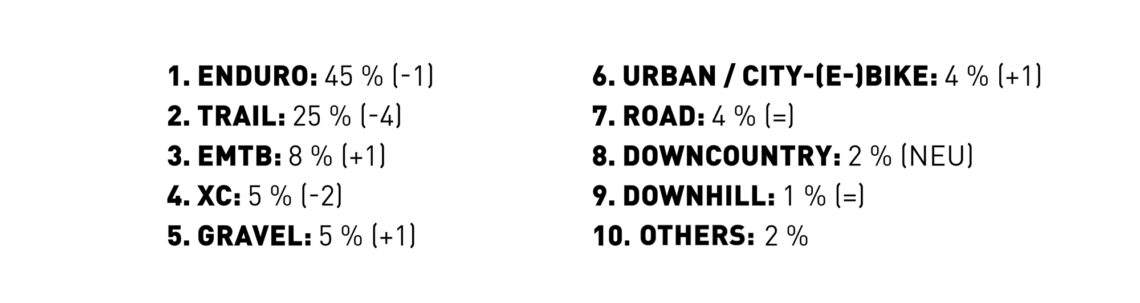
Of course, we also wanted to know which type of bike you prefer riding because most of you have several bikes parked in the basement, garage or even living room. By the way, each of you owns an average of 3.4 bikes. Enduro bikes remain in first place at 45%, dropping by one percentage point compared to last year. Trail bikes have dropped by more than 4 percentage points, but they’re still in second place at 25%. For the first time, eMTBs have made it to third place, increasing by about one percentage point to make up 8% in total. Meanwhile, XC bikes have dropped down to fourth place with a loss of almost 2 percentage points, totalling about 5%. Gravel bikes come in very close behind them with just under 5%. On the one hand, this shows that drop-bar bikes are merely a supplement to mountain biking despite many of you owning one and, on the other hand, that mountain bikers ride their gravel bikes a lot more than their road bikes, which isn’t a big surprise. On average, you’ve owned your current bike for around 29 months and paid € 4,225 for it. This isn’t just 4 months less than last year, but you also paid over € 400 more.
Which bike brands do you ride?
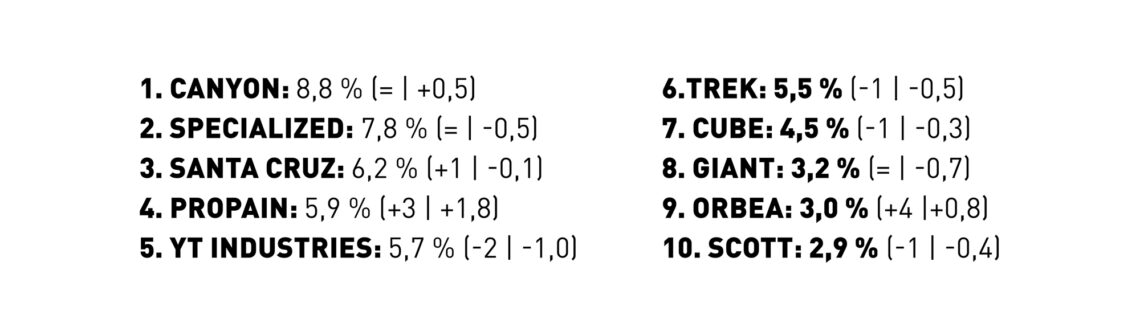
It’s neck and neck in the top 10 most popular brands. A few percentage points up or down can quickly mean several places here. Canyon are still in P1, now making up 9%. Although Specialized have lost some ground, they still come in at about 8% and thus secure second place. YT recorded a slight crash this year, relegating third place to Santa Cruz, who continue making up 6%. Meanwhile, YT have dropped to 5th place, losing about one percentage point, and coming down to less than 6% overall. Propain have gained ground and reached fourth place, an all-time high for them. With an increase of almost 2 percentage points, Propain now sit at 6%. Incidentally, this coincides with the results of our 2021 survey, in which Propain was at the top of your shopping list. Orbea are another Top 10 winner, gaining almost one percentage point to a total of 3%, moving up 4 places to 9th overall.
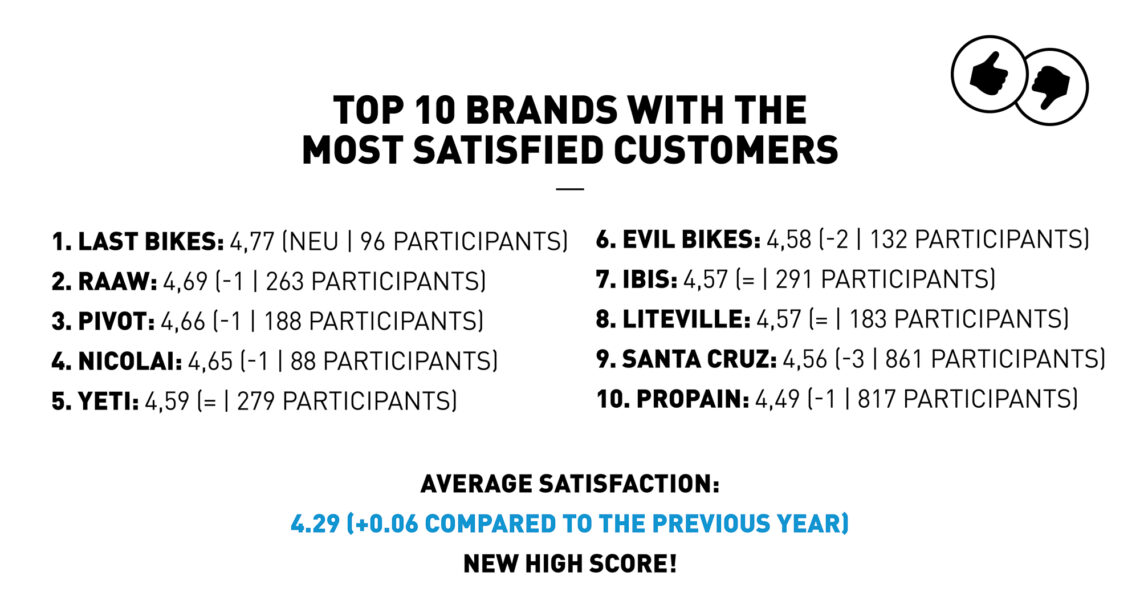
How happy are you with your bikes?
You rated your favourite bike on a scale from 0 (not satisfied at all) to 5 (completely satisfied). Fortunately, the upward trend of the previous year continues, and the overall average rose by 0.06 points to 4.29. This is the highest value we have ever recorded!
Of course, we also wanted to look at the brands with the most satisfied customers. It should be noted that only brands with at least 80 votes have been considered in order to obtain representative results. You will find many old acquaintances in the top 10, but there’s a newcomer, too, going right ahead and securing pole position. We’re talking about LAST Bikes, who already achieved high ratings in recent years but didn’t have enough votes to be considered. This year, however, LAST Bikes got enough votes, coming first with an average rating of 4.77 and a clear margin. Behind them is last year’s leader, RAAW, with an average rating of 4.69. Pivot have also slipped one place down and are now in 3rd with an unchanged average rating of 4.66. 4th and 5th place went to NICOLAI and Yeti with a rating of 4.65 and 4.59, respectively. Due to slight losses, Evil Bikes have dropped by 2 places this year, now finding themselves in 6th place with a 4.58 average. Ibis and Liteville both performed well in the rating but remain in 7th and 8th place. Thus, Santa Cruz had to move to 9th place despite just a minimal loss. Propain complete the top 10 with an average of 4.49. A word of praise at this point to Santa Cruz and Propain, who are the only brands that managed to finish both in the top 10 of your current bikes and the satisfaction ranking.
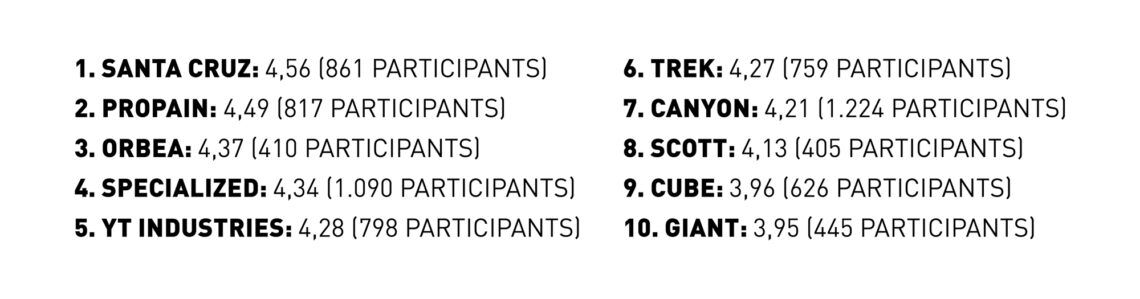
Which big brand has the most satisfied customers?
What is striking about the previous ranking is that it is dominated by more of your niche type brands. Those who buy a bike like this usually know exactly what they want, as well as what they get with the bike, and so they’re more likely to be satisfied with it. Therefore, we wanted to look at the big brands’ customer satisfaction ratings in isolation, considering all brands with more than 400 participants. Santa Cruz and Propain, who also made it into the Top 10 overall, are followed by Orbea, Specialized and YT Industries.
What do you want to buy next?
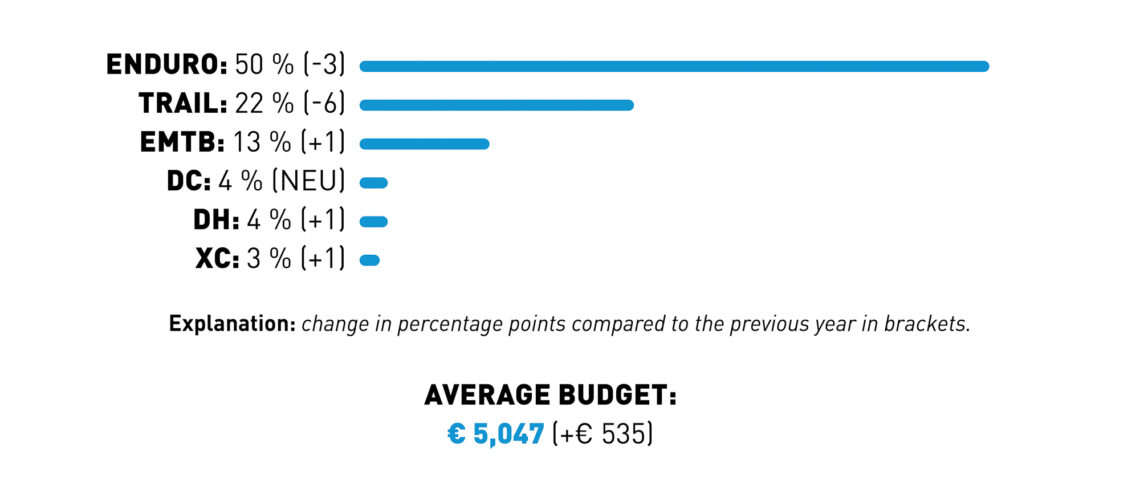
First of all, let’s look at your general purchase intentions. This year, 22% said they want to buy a new bike in the next 12 months. With a drop of almost 4 percentage points, this is significantly less than a year ago and shows that the financial situation is tense, despite an increased average household income. Another 30% aren’t yet sure if they will buy a new bike next year. Accordingly, 48% said they would not buy a new bike, which is 6 percentage points higher than in the previous year. Incidentally, your average budget for a new bike is over € 5,000, which is more than € 500 more than in 2021. So much for the tense financial situation we mentioned just now. We think you’ve got priorities in the right place and know where not to save.
Of course, when it comes to the types of bikes you want to buy, enduro bikes are in first place here, too, and make up 50%, which is 3 percentage points less than the year before. Trail bikes have lost almost 6 percentage points, though they remain in second place at 22%. Perhaps some have migrated to the new downcountry category, which debuts in 4th place at about 4%. The eMTBs remain in 3rd place at 13%, able to gain another percentage point. Downhill bikes rank 5th at just under 4%, followed by XC bikes at around 3%.
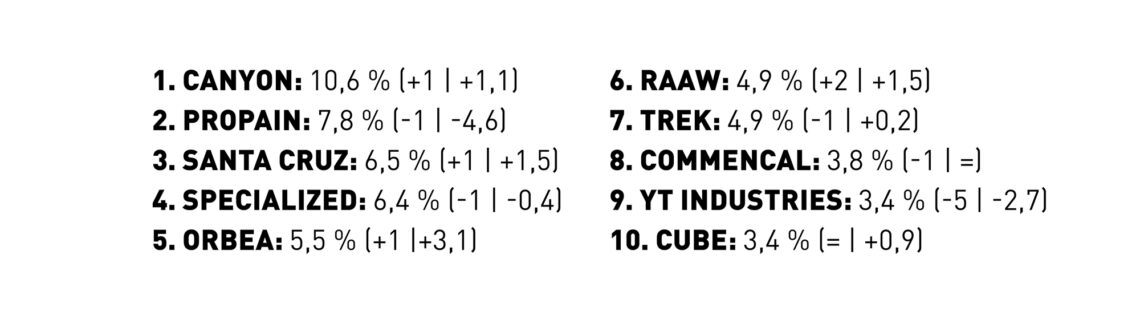
Which brand do you want to buy next?
After Canyon and Propain swapped places last year, it’s the other way around for 2022 and Canyon are back in the top position. With an increase of more than one percentage point, the German bicycle brand are at almost 11%. Propain have had a significant loss of almost 5 percentage points. This puts them in second place at 8%. However, we don’t see any reason for concern for Propain, but rather a saturation of the market since the German bike brand were in first place last year and saw a significant increase in the bikes currently owned this year. Santa Cruz were able to make significant gains this year, climbing to 3rd and relegating Specialized to 4th. Orbea showed the biggest increase with a gain of more than 3 percentage points, putting them in 5th place. Following hot on their heels are RAAW, other big gainers who were able to increase by 1.5 percentage points to almost 5% overall. YT, on the other hand, suffered heavy losses this year and fell from 4th to 9th place.
What do you look for in a bike?
Current bike
We wanted to know what you looked for when buying your current bike. Clearly, the most important aspect was the performance, which was the deciding factor for 64% of our readers. What we mean by performance is the handling and the performance of your bike’s suspension. The components (57%) and the price (48%) also ranked high in your list of priorities. At 35%, the looks also played an important role. Availability mattered to just 18% of you. Given the current market, we wouldn’t have been surprised if this number had been significantly higher. The brand image (13%) and the weight (12%) don’t seem to be all that important.
Next bike
You’re looking for very similar things in your next bike. Accordingly, performance remains the top priority. For this question, you were able to give a rating on a scale from 0 (unimportant) to 5 (very important). The most important criterion was the handling with an average rating of 4.57. The suspension comes in at a close second place with 4.53 average. Landing in third place with an average of 4.13 are the components. We agree, the components are undoubtedly important, but the basis must be right first and foremost. Though less important, ride comfort (4.04), design (3.58) and price (3.58) were rated highly, too. With an average rating of 3.14, sustainability also plays an important role. Weight got an overall rating of just 3.06 and brand image seems to matter even less at 2.69. Of course, it can’t be ruled out that the brand image may have a subconscious effect. It’s interesting that almost all the ratings have increased significantly – by as much as 0.1 points in some cases. That can only mean that your expectations are growing. And they should be because the bikes are getting better and better!
What else do you do besides biking?
Of course, while bikes are our focus, you might have many other interests besides. Travel is at the top of the list. Fortunately, travel and riding go hand in hand. Unsurprisingly, 77% of you travelled with your bike in tow during the last year. On average, you spent 9 days on a bike trip, and it cost you € 185 per day. Most of your holiday time was spent in bikeparks with flow trails and jumps, but many of you also visited trail centres without shuttle or lift support and other recreational areas. In this context, camping and van life pursuits also ranked highly, with 37% showing an interest in that. In addition to travelling, cars, photography and tech are of great interest too. For your physical and mental well-being, you like good coffee.
Other mountain bike trends
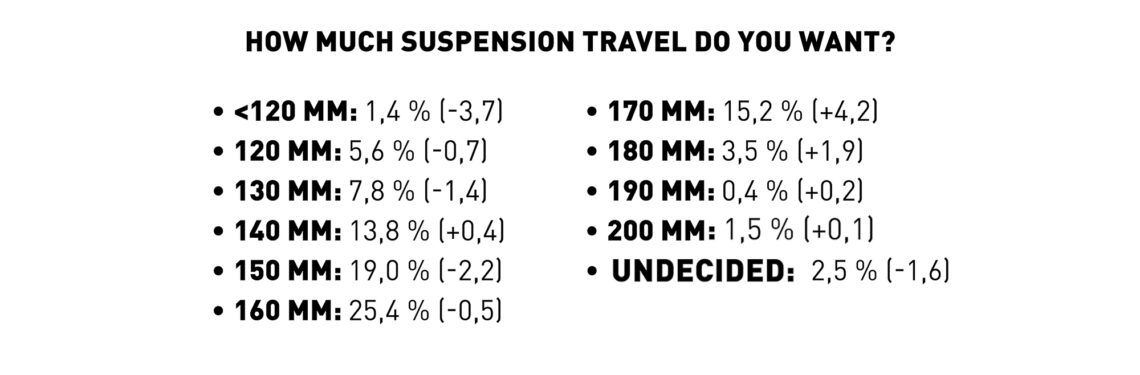
We’re seeing a trend towards more travel with the majority now between 150 and 170 mm
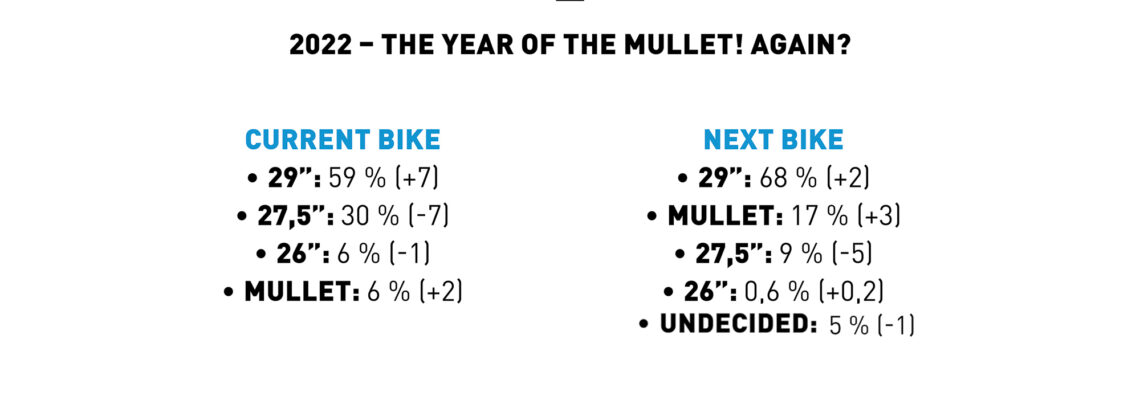
After announcing 2021 to be the year of the mullet, the trend has gathered even more pace this year and is increasingly displacing pure 27.5″ setups. Nevertheless, 29ers still dominate the field with more than 2/3 of the planned purchases.
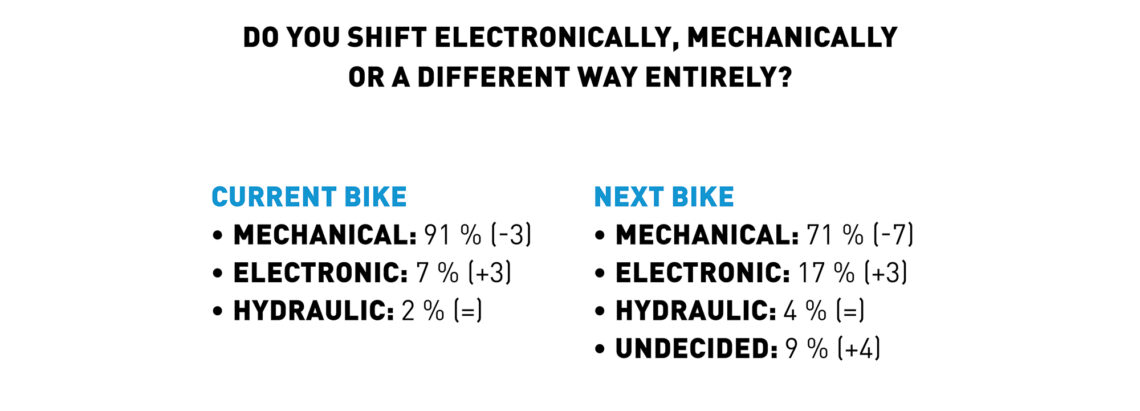
Although the tried-and-tested mechanical drivetrains remain firmly established in the mountain bike world, electronic shifting is growing in popularity.
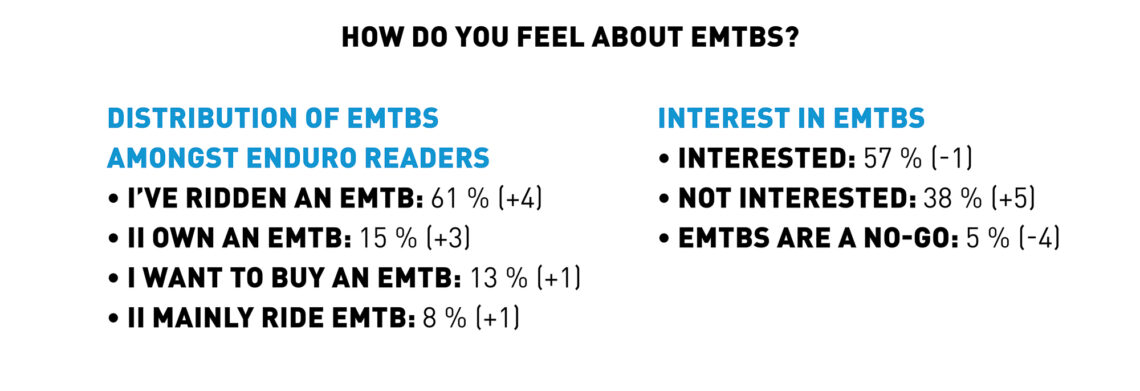
The spread of eMTBs continues, but, interestingly, the general interest seems to have peaked. Nevertheless, the anti-eMTB sentiment is dwindling, reaching a new low at 5%.
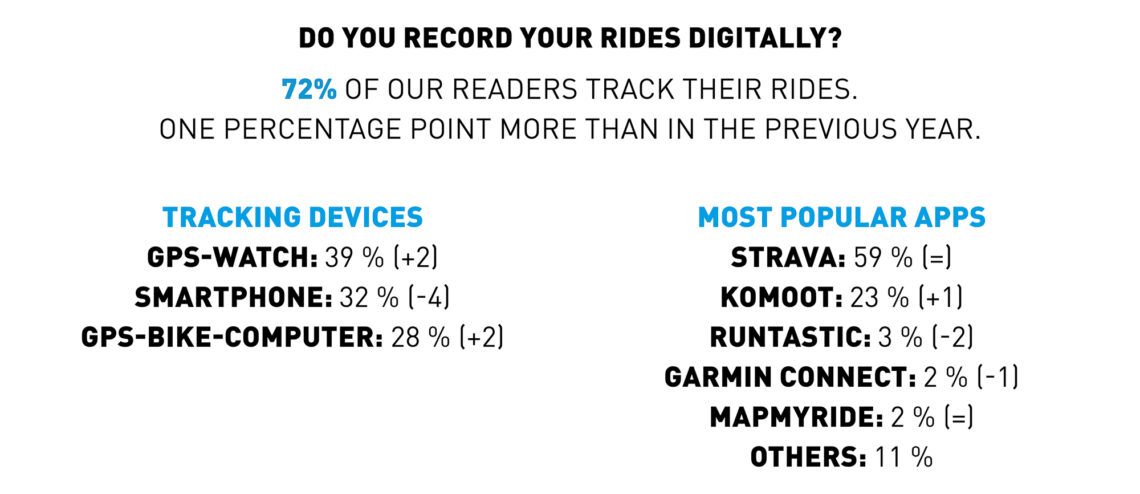
While the majority of ENDURO readers track their rides, the trend is slowing down. It’s interesting to note that more and more riders who track their rides do so with dedicated devices instead of their smartphones.
How do you rate our products?
The reader survey presents an excellent opportunity for us to get feedback on our work. Besides plenty of constructive criticism, we also got a lot of praise. Many thanks for both!
Our app has been very well received and gets used regularly by 45% of you. On average, you gave it a 4.5 star rating. The free, digital magazine is the heart of what we do and undoubtedly the best way to experience our content. It offers lots of interactive features, high-resolution images and videos, and a unique design. If you haven’t already, make sure to download the app now to gain early access to our content!
The lucky winners
One of the reasons we like our reader survey so much isn’t just that we can get to know our readers better, but also that we can surprise you with a new bike. Together with our competition partners, SIMPLON and RAAW, this year we raffled off prizes to a total value of over € 7,000. Due to lack of availability, the two winners are still waiting for their bikes. We’ll post the pictures on our website and on social media as soon as the bikes have been handed over to their new owners.
So, those were the results of our 2022 reader survey. And as you can see, it’s worth participating for a variety of reasons. Whether mullet, eMTBs or electronic drivetrains, we’re curious to see how these and other trends will develop in the coming year. Keep your eyes peeled for our next reader survey in the spring of 2023.
Did you enjoy this article? If so, we would be stoked if you decide to support us with a monthly contribution. By becoming a supporter of ENDURO, you will help secure a sustainable future for high-quality mountain bike journalism. Click here to learn more.
Words: Photos: Julian Lemme